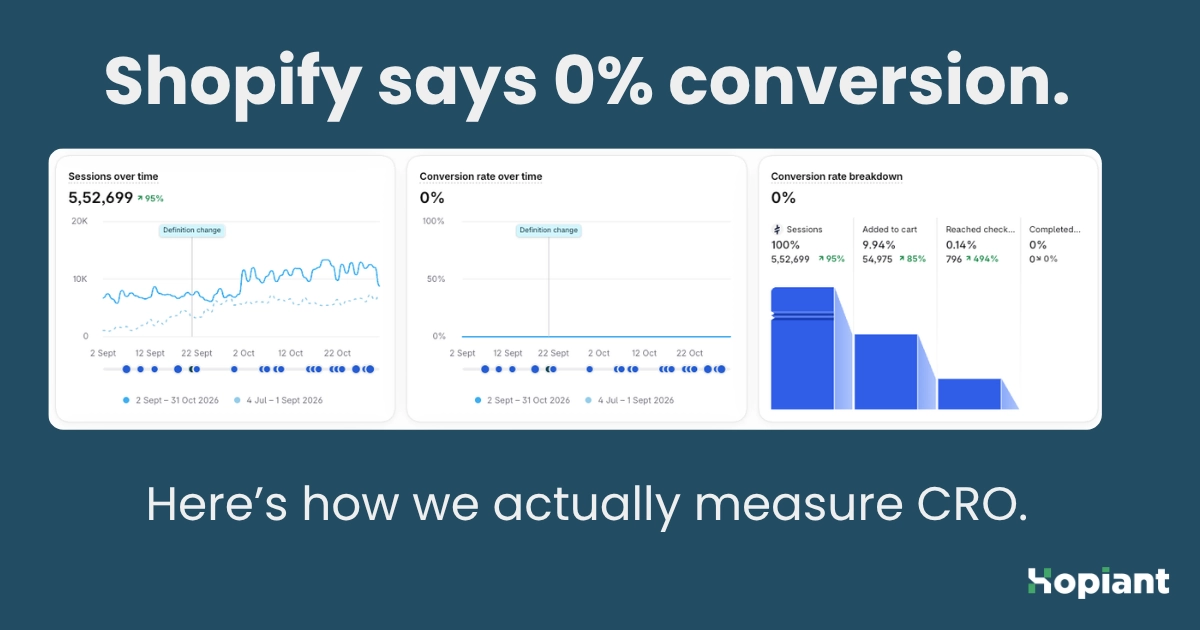
One of our clients processed 4,844 orders in 20 days. Their Shopify conversion rate, according to the dashboard, was 0%.
Nothing was wrong with the store. The checkout runs on a third-party app, and Shopify's funnel can't see what happens there. Many Indian D2C stores use a third-party checkout app for one-click checkout and cash on delivery. If yours does, check your dashboard for the same thing.
The catch is that you can't run conversion work, or judge an agency's results, if you can't measure conversion. This post shows the simple method we use instead. We walk through it with real numbers from a client engagement, and we're clear about what those numbers prove and what they don't.
Why the Shopify funnel breaks
Shopify's conversion funnel counts four steps: sessions, added to cart, reached checkout and completed checkout. The last two are built around Shopify's own checkout.
A third-party checkout takes the shopper to its own page or pop-up. Shopify mostly loses sight of the shopper from that point. The order still lands in Shopify, but most of the funnel events don't.
Here is what that looked like for our client over the same 20 days (14 Aug – 2 Sept 2026):
Funnel step (Shopify)
What it showed
What really happened
Reached checkout
43 sessions
Every one of the 4,844 orders went through checkout
Completed checkout
0%
4,844 orders were placed
The problem didn't go away on its own. This is the same store's dashboard for 2 Sep–31 Oct 2026. It shows 5.5L sessions and 54,975 add-to-carts, but only 796 sessions reaching checkout and a flat 0% conversion line. The store took 18,618 orders in that period.
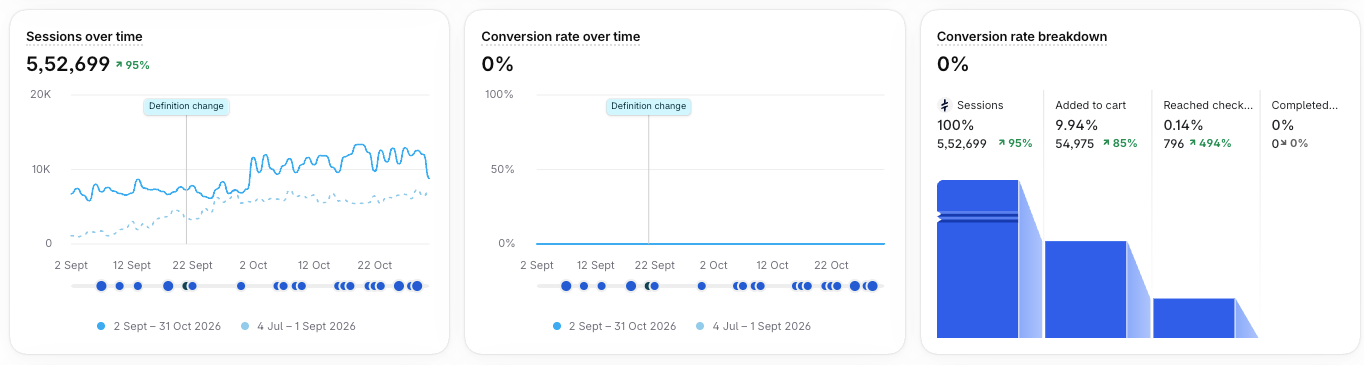
Notice the "Definition change" marker on 21 Sep too. Shopify changed how it counts sessions from that date. The sessions line doesn't jump at the marker, but counts after it aren't measured the same way as counts before it. Applied to this period, our method gives 18,618 ÷ 5,52,699 = 3.37%. We don't compare that with July–August, because the session definition changed partway through and a festival sale ran in late October. That's the first rule below in action.
So the conversion tile isn't a little off. It measures something that no longer exists on this store. Any CRO report built on it is wrong from the start.
How to calculate your Shopify conversion rate with a third-party checkout
We skip the broken checkout events. We take the two numbers Shopify still records correctly, orders and sessions, and divide one by the other.
Commercial conversion rate = orders recorded in Shopify ÷ sessions recorded in Shopify
It isn't a perfect funnel metric. It can't tell you where shoppers drop off between cart and payment. But both numbers are recorded reliably, both are already in your dashboard, and the result tracks the outcome you care about: visits turning into orders.
Two rules keep it honest:
- Compare equal periods. We use the same number of days before and after, and note any sale, offer or ad change between them.
- Report it beside add-to-cart rate. Add-to-cart still records correctly, so it shows whether product and collection pages are doing their job.
A worked example
Our client is a fast-growing Indian D2C brand on Shopify with a third-party checkout. We compared two back-to-back 20-day periods: 25 Jul–13 Aug and 14 Aug–2 Sep 2026. A round of our CRO changes, including the new theme update and prepaid checkout messaging, went live on 12 Aug, just before the second period began.
Metric
Before
After
Change
Sessions
119,250
124,709
+4.6%
Orders
4,262
4,844
+13.7%
Commercial conversion rate (orders ÷ sessions)
3.57%
3.88%
+0.31 pts (+8.7%)
Add-to-cart rate
10.12%
11.31%
+1.19 pts
Revenue per session
₹30.76
₹33.27
+8.1%
Average order value
₹870
₹880
+1.1%
The first thing to look at is the gap between two growth rates. Sessions grew 4.6% but orders grew 13.7%. More visits alone would not explain that. The store got better at turning visits into orders.
Average order value barely moved. So the extra revenue came from more orders, not bigger baskets.
Separating traffic from conversion
Orders went up by 582. Some of that came from more visitors, some from converting them better. To split the two, we ask one question: how many orders would the new traffic have produced at the old conversion rate?
124,709 sessions × 3.57% = 4,457 expected orders
The store actually took 4,844 orders, about 387 more than that baseline. Those 387 orders are the part linked to better conversion. The other 195 came from extra traffic.
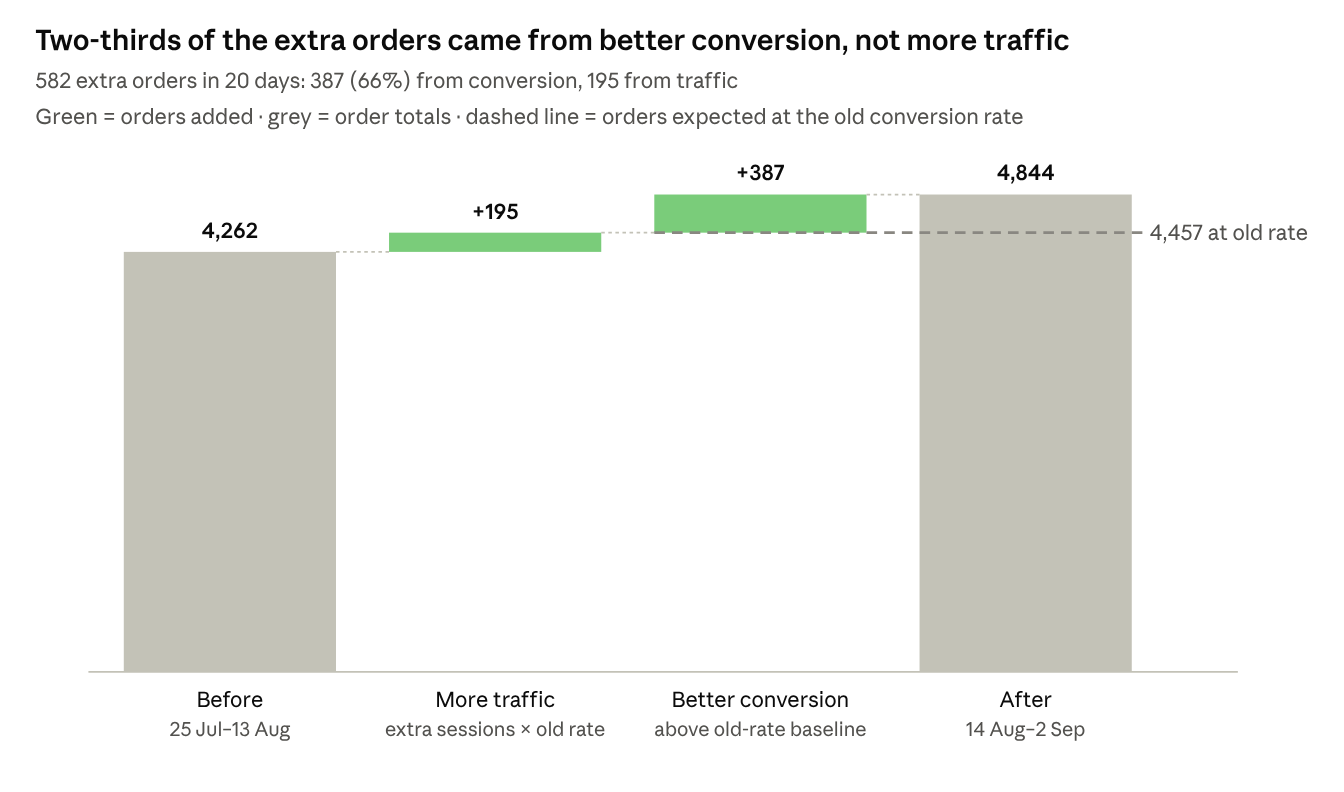
At about ₹856 in sales per order, the 387 orders were worth roughly ₹3.31 L in 20 days. A second check gives a similar figure: revenue per session rose from ₹30.76 to ₹33.27, which is about ₹3.13 L across the period.
What this does not prove
This was a before/after comparison, not an A/B test. It shows the store converted better after our changes. It does not prove our changes were the only reason. Here is what we told the client, and what we'd tell you:
- Other things changed too. Discounts rose from 24.9% to 29.3% of gross sales in the second period. Bigger offers can lift conversion on their own.
- Cart-to-order didn't improve. Orders per add-to-cart slipped from 35.3% to 34.3%. The gains came from product and collection pages, not from the checkout handoff. That's the next problem to solve.
- 20 days is a short window. Seasonality, ad changes and stock levels can all move these numbers.
- ₹3.31 L is an estimate. It's the value of the orders above the old-rate baseline. It isn't profit, and it isn't a guarantee for future periods.
To prove cause and effect, the next step is a controlled test. Split traffic between the old and new experience, keep offers the same for both, and measure the difference with a confidence interval. We recommended exactly that.
How to fix checkout tracking
Orders ÷ sessions is a stopgap. The real fix isn't in your Shopify plan: Basic, Advanced and Plus all record orders the same way. It sits with your checkout app, because that's where the purchase happens. Ask your checkout provider these four questions:
- Is each purchase linked to the Shopify cart it came from? Without that link, your analytics can't join the order to the visit and the ad that brought it.
- Do you send purchase events to GA4 and Meta from your server? Server-side events survive ad blockers and closed tabs. Ask whether it's available and switched on for your store.
- Does the visit survive the jump to checkout? If the checkout opens on a different domain, it needs cross-domain tracking. A pop-up checkout on your own domain usually doesn't.
- Can we check the numbers every day? Compare purchases in GA4 and Meta with Shopify orders, leaving out test, cancelled and duplicate orders.
Until tracked purchases match Shopify orders within ±2%, keep orders ÷ sessions as the number you report every week.
If your store uses Shopify's own checkout, you don't need any of this. Shopify records the full funnel itself, on every plan.
Frequently asked questions
Why does my Shopify conversion rate show 0%?
If your checkout runs on a third-party app, Shopify usually can't record the "reached checkout" and "completed checkout" steps. The conversion rate then shows 0% or close to it, even while orders keep coming in. A quick check: compare your order count with your completed-checkout sessions for the same period.
How do I calculate conversion rate in Shopify with a third-party checkout?
Divide the orders recorded in Shopify by the sessions recorded in Shopify for the same period. Compare periods of equal length, and note any sale, offer or ad change between them.
Is orders ÷ sessions the same as Shopify's own conversion rate?
Not exactly. Shopify counts sessions that completed checkout, while this method counts orders. A shopper who places two orders in one visit counts once in Shopify's figure and twice in ours. Pick one method and use it for every period you compare.
Do headless or Hydrogen stores have the same problem?
They can, for a different reason. Hydrogen stores send storefront events to Shopify Analytics, but conversion tracking only works when the storefront, cookie consent and Shopify Checkout are connected correctly. That's a separate fix from a third-party checkout.
The short version
If your Shopify dashboard says 0% conversion and you use a third-party checkout, don't trust the tile. Divide orders by sessions, compare equal periods, and separate traffic growth from conversion growth before you claim a win. Then fix the tracking so you don't need the workaround.
We're Hopiant, a Shopify execution partner for D2C brands and agencies. If your numbers don't add up and you'd like a second pair of eyes, get in touch. We'll tell you what your data can and can't show. For a fuller example of our work, read the RomperJack case study.